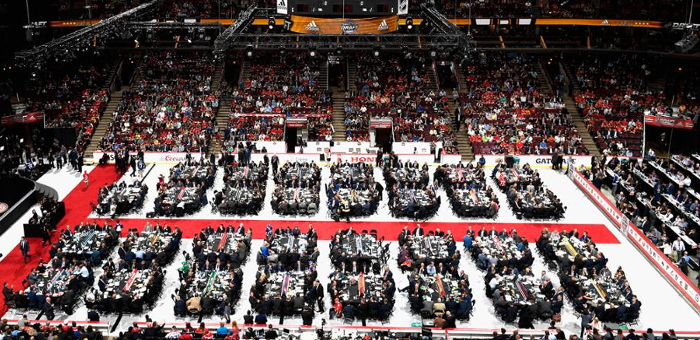
Best and Worst Teams at Finding NHL Players from the Draft
Jokke Nevalainen
2020-05-30
This is the third and final article about the topic of finding NHL players from NHL Drafts. I have been going through a span of 10 years – from the year 2000 to 2009 – and reviewing the results from different angles. In the first article (link), I focused on general probabilities of finding NHL players from a draft and different parts of the draft. In the second article (link), I broke those results down by positions to see what kind of differences there are between forwards, defensemen and goaltenders.
In this article, I will focus on the NHL teams making those selections. Ever since the first article, I’ve often been asked which teams have been the most successful at finding NHL players from the draft. It took me a while to figure out how to answer that question but I finally figured out a way to do it fairly.
Expected Return
The first step I took was assigning Expected Return value for each selection made in the draft. I used the same ranges that were used in the previous article, so the first round is split into three groups, and then each round is their own group, although rounds five and six are combined because no noticeable difference has been noticed in that range.
For example, if in a certain range there were a total of 100 selections made and 25 of those went on to become NHL players, then the Expected Return value in that range would be 0.25 (25/100). To quantify an NHL player, I used the same 100 games played threshold that I’ve been using in the previous articles as well.
The Expected Return values for different parts of the draft are shown in the table below.
| Draft pick range | Expected Return |
| Range 1 (1-5) | 1.00 |
| Range 2 (6-14) | 0.77 |
| Range 3 (15-30) | 0.65 |
| Range 4 (31-60) | 0.34 |
| Range 5 (61-90) | 0.27 |
| Range 6 (91-120) | 0.22 |
| Range 7 (121-180) | 0.15 |
| Range 8 (181-210) | 0.11 |
Expected Return vs Realized Return
After assigning the Expected Return value for each pick made in that span of 10 years, it was easy to calculate the total sum of Expected Return for each team. Once I had that total sum calculated for each team, I compared those numbers to the amount of NHL players that each team managed to find from those 10 drafts.
The full results are shown in the table below.
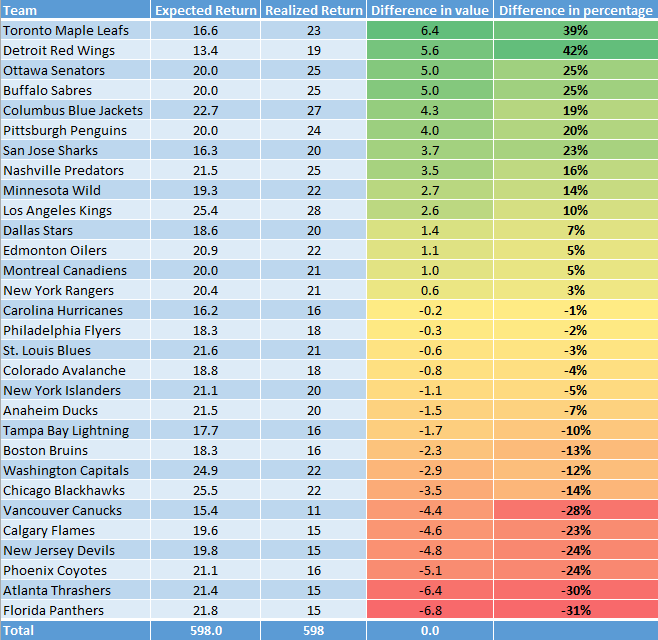
The Best
As you can see from the table above, Toronto and Detroit were in a class of their own. They managed to find about 40 per cent more NHL players than what was expected considering the draft picks they had. Detroit’s Expected Return value (13.4) was the lowest in the league but they managed to find more NHL players than 11 teams. Both teams did a remarkable job. Hats off to them and their scouting staffs.
Ottawa, Buffalo, Columbus, Pittsburgh and San Jose did a very good job as well, finding between 19 and 25 per cent more NHL players than what they were expected to find. This can be considered a great success for sure.
Nashville, Minnesota and Los Angeles were clearly above average as well. Los Angeles actually managed to find the most NHL players (28) but they also had the second-highest Expected Return value (25.4), so they didn’t get significantly better results compared to the expectations.
The Worst
At the other end, Florida and Atlanta had absolutely horrible results. They found just 15 NHL players each even though they had the draft picks that should have brought them 21 or 22 players. Losing about 30 per cent of your Expected Return value is definitely not a recipe for success.
In addition to those two, Phoenix, New Jersey, Calgary and Vancouver also had terrible results. They should have found four or five NHL players more than they did. Vancouver only found 11 NHL players in a span of 10 years, which was the lowest number by far – all other teams were between 15 and 28 – but they also had the second-lowest Expected Return value (15.4) which makes it a bit more understandable.
Chicago, Washington and Boston were the other team that were clearly below average. Chicago’s Expected Return value (25.5) was the highest among all the teams, and Washington’s was third (24.9). They both found 22 NHL players, which is a very good number over a span of 10 years. But they had so many good draft picks that they should have been able to find even more.
The Average
The other 11 teams – from Dallas to Tampa Bay – I would classify as average in this regard. They pretty much found the amount of players they were expected to find, with only small variation.
Final thoughts
So there you have it – the best, the worst, and the average. Were you surprised by these results?
I didn’t have any expectations going into this analysis. But looking at the results, I can understand why Detroit managed to have continued success for such a long period of time. Obviously their success was built around star players like Henrik Zetterberg and Pavel Datsyuk, both of whom were drafted in the 1990s, so they weren’t included in this analysis. But they managed to find new NHL players consistently despite not having high draft picks and trading away picks for playoff runs.
I can also understand why Florida has been struggling for so long and why the Atlanta Thrashers had to relocate to Winnipeg. If you don’t find players from the draft, you end up giving away assets to acquire them or overpaying for free agents. The draft is such an important part of building a team.
Of course, it’s very likely that things have changed over the past 10 years because team executives and scouting staffs have largely changed during that time. Unfortunately, we don’t really know how good or bad they are until about 10 years from now because we have to wait and see which players actually make it to the NHL and stay there.
Please remember that this analysis focused purely on finding NHL players. The quality of the players was not taken into consideration at all, so a player who plays 100 NHL games on the fourth line is worth the same as a Hall of Fame player.
My next goal is to find ways to quantify the quality of the players in a way that would allow me to use it for similar analyses. But I’m still not exactly sure how I’ll do that, so I’ll need some time to figure it out.
*
And that’s all for now, thanks for reading. Remember to follow me on Twitter @JokkeNevalainen.
Main picture courtesy of NHL.com
LATEST PROFILE UPDATES
LATEST RADIO & DRAFTCASTS
Dobber’s DraftCast S2E8: Atlantic Division Prospects with a chance to make the roster
On this episode: Pat is joined by Ben to discuss prospects in the Atlantic Division who have a chance to make the roster to start, have cups of coffee, or may be up after the trade deadline. This talk is to help fantasy hockey GMs decide on prospects to add, watch or invest in for […]
Dobber’s DraftCast S2E7: Metro Division Prospects with a chance to make the roster
On this episode: Pat is joined by Ben to discuss prospects in the Metro Division who have a chance to make the roster to start, have cups of coffee, or may be up after the trade deadline. This talk is to help fantasy hockey GMs decide on prospects to add, watch or invest in for […]
Dobber’s DraftCast S2E6: Central Division Prospects with a chance to make the roster
On this episode: Pat is joined by Ben to discuss prospects in the Central Division who have a chance to make the roster to start, have cups of coffee, or may be up after the trade deadline. This talk is to help fantasy hockey GMs decide on prospects to add, watch or invest in for […]
