NHL Draft Pick Probabilities By Position
Jokke Nevalainen
2020-05-24
After the first article about NHL Draft Pick Probabilities (link) was released, there were some asking for something similar but with different player positions being separated to see if there are any differences there. That raised my interest, so I decided to use the same data I had already available to see what type of differences there are between drafting forwards, defensemen and goalies.
As a reminder (or if you haven’t read the first part), I took draft results from a span of 10 years between 2000 and 2009. I took the first 210 selections from each draft (30 teams and seven rounds) to have comparable results from each year. All data taken from www.hockey-reference.com.
Please notice that I’m not a mathematician or even an analyst. There are a lot of people who are way more qualified to do this type of an analysis. But I love charts and I love playing around with numbers on Excel, so that’s what I did here. My goal wasn’t to create some ground-breaking analytical breakthrough but instead provide results that are easy to understand and maybe even remember.
Without further ado, let’s go through the results.
Players drafted per position
The first thing I wanted to look at was the amount of draft selections used on the three positions. Essentially, what percentage of the 2,100 draft choices in question were used on forwards, defensemen and goalies.
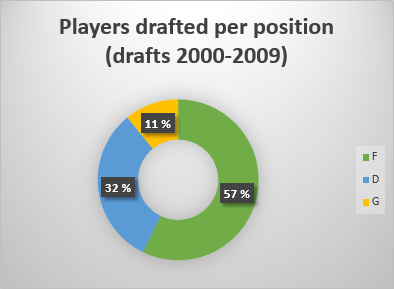
When I saw the results, I started wondering if there’s any sort of logic behind it. And then it hit me; it’s basically the composition of a standard 22-man NHL team roster. Here’s a similar chart showing a roster of 13 forwards, seven defensemen and two goalies.
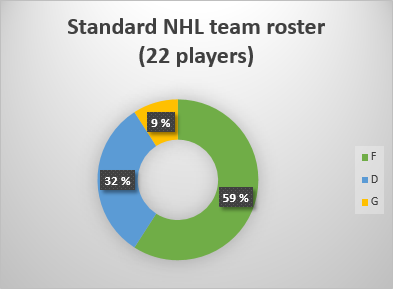
So over a long period of time, NHL teams are basically allocating draft capital to match their team roster. Which makes sense when you think about it but it’s sort of interesting to see how closely they mimic each other. Or maybe this was obvious to everyone else but me.
Now that we know what portion of draft picks are used on which position, I wanted to see if that changes at different parts of the draft. I split the draft into eight ranges, and I used similar ones that were used at the end of the first article – but this time, I used the actual numbers when we had 30 teams in the league:
- Top five (1-5)
- Other lottery picks (6-14)
- First round for playoff teams (15-30)
- Second round (31-60)
- Third round (61-90)
- Fourth round (91-120)
- Fifth and sixth round (121-180)
- Seventh round (181-210)
Fifth and sixth rounds are combined because there doesn’t seem to be any noticeable difference between those two rounds, as seen in the first article as well. Here are the full results.
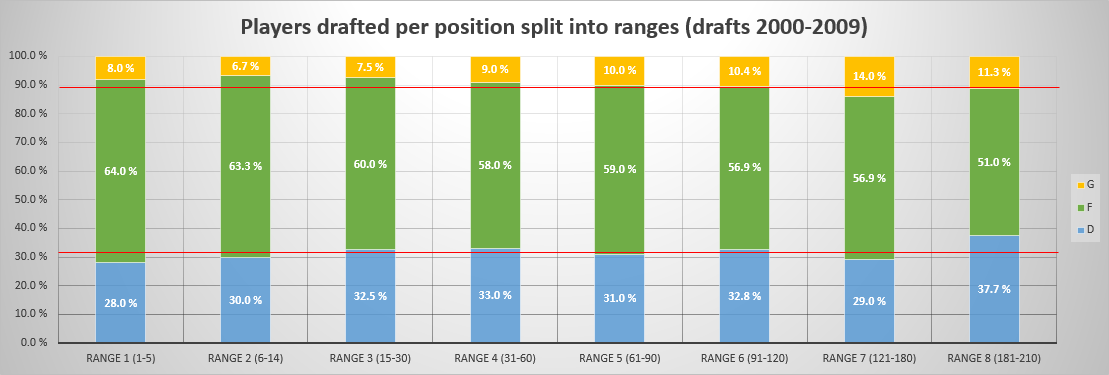
I added red lines at 32% and 89% to make it easier to see where the average for defensemen and goalies is. With defensemen, the percentage remains pretty similar throughout the draft with only the seventh round being a clear outlier – it appears NHL teams love spending their final picks on defensemen.
As for the goalies, only 8.2% of draft picks in the first two rounds were used on them. But it appears NHL teams love grabbing goalies in the fifth and sixth round where they used 14% of the picks on them – a clear outlier compared to every other round.
Draft pick success rate per position
Now that we know what portion of draft picks is used on each of the three positions, let’s see what kind of success rates there have been for them. Like in the previous article, I used 100 NHL games as the benchmark to define a successful draft pick. In the future, I may expand this work to have better ways to define a successful draft pick but for now, let’s focus on finding NHL players.
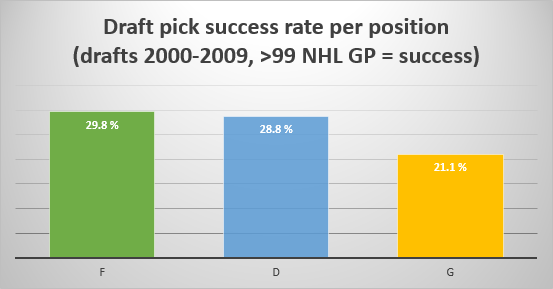
With both forwards and defensemen, about 30% of the players who were drafted ended up becoming NHL players whereas with goalies, that number is only 21.1%. That is a clear difference between skaters and goaltenders but that alone doesn’t say a lot because we don’t know where exactly they were drafted, so let’s focus on that next.
The next chart is a busy one but I used colors to separate positions, and I used the same ranges mentioned in the previous section of this article, so hopefully those two things make it readable.
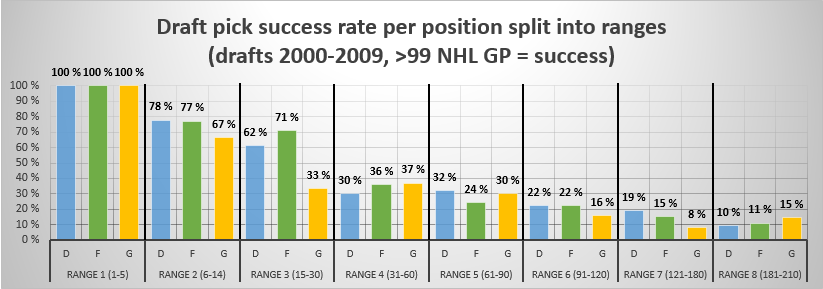
As mentioned in the previous article, top five picks are money in the bank regardless of the position. In that six to 14 range, forwards and defensemen are neck and neck. There’s a noticeable difference between skaters and goalies in that range but the difference is actually smaller than I would have expected; 77.2% vs 66.7%.
The late first round range seems to be where the biggest differences occur. With forwards, the success rate doesn’t change a lot between ranges two and three; from 77% to 71%. But with defensemen, there’s a big drop-off, going from 78% to 62%. I’m not sure why there’s such a difference between forwards and defensemen there.
But the biggest drop-off happens with goalies who go from 67% to 33%. It seems NHL teams haven’t been very good at drafting goalies late in the first round. You don’t want to see 1/3 odds when spending something as valuable as a first round pick.
The second round range is very interesting because goalies have actually been the safest bets in that range. In fact, the success rate for goalies is better in the second round than what it was in the second half of the first round. That’s not good.
Only 30% of defensemen drafted in the second round have become NHL players – that’s pretty shocking to me. In general, the second round has been much worse than most people expected it to be.
The third round, in turn, is where trouble begins for forwards. Defensemen actually improve slightly from the second round but forwards see a pretty big drop-off there, going from 36% to 24%.
Goalies drop a little bit as well but not as much. In fact, the third round has been almost as good for goalies as the late first round range – again, that’s not good.
Remember that high amount of draft picks used on goalies in the fifth and sixth round? Yeah, it hasn’t been working so well; only 8.3% of those picks have turned into NHL players, the lowest success rate anywhere in the draft. They spent 84 draft picks to find seven NHL goalies.
But in the seventh round, NHL teams have found five NHL goalies while using just 34 picks on goalies there.
Goalies and the draft, man.
Final thoughts
Based on the results here, it appears forwards are the safest bets to draft, especially in the first two rounds. But that’s not shocking because the wing is the easiest position to play in the NHL. The lead they had over defensemen in the second half of the first round was surprising to me, and I’ll definitely remember that in the future.
When it comes to goalies, don’t worry too much about the guys in the top 15; they don’t appear to be significantly riskier than the skaters in that range but there’s still a bit more risk there. But it appears you don’t get good bang for your buck taking goalies in the second half of the first round – the second and third rounds appear to be the optimal time to draft netminders.
Or maybe the seventh round. When it comes to goalies, nothing seems to make sense.
*
And that’s all for now, thanks for reading. Remember to follow me on Twitter @JokkeNevalainen.
Main picture courtesy of NHL.com
LATEST PROFILE UPDATES
LATEST RADIO & DRAFTCASTS
Dobber’s DraftCast S2E8: Atlantic Division Prospects with a chance to make the roster
On this episode: Pat is joined by Ben to discuss prospects in the Atlantic Division who have a chance to make the roster to start, have cups of coffee, or may be up after the trade deadline. This talk is to help fantasy hockey GMs decide on prospects to add, watch or invest in for […]
Dobber’s DraftCast S2E7: Metro Division Prospects with a chance to make the roster
On this episode: Pat is joined by Ben to discuss prospects in the Metro Division who have a chance to make the roster to start, have cups of coffee, or may be up after the trade deadline. This talk is to help fantasy hockey GMs decide on prospects to add, watch or invest in for […]
Dobber’s DraftCast S2E6: Central Division Prospects with a chance to make the roster
On this episode: Pat is joined by Ben to discuss prospects in the Central Division who have a chance to make the roster to start, have cups of coffee, or may be up after the trade deadline. This talk is to help fantasy hockey GMs decide on prospects to add, watch or invest in for […]
