Prospect Ramblings: Decade of Drafting (Part 3)
Pat Quinn
2020-07-01

Welcome to the Thursday prospect ramblings where I have come back to work on the decade of drafting series I have been going over. This week I decided to go through some USA junior/college leagues that get drafted in to the NHL. I am not 100% certain how these leagues work as they seem to come and go randomly, swap teams in leagues, and/or get renamed. This week I am going to go over the USNTDP, NAHL, CCHA, Big Ten, H-East, WCHA, and the NCHC.
Now I did some research and from the article (not going to lie it was Wikipedia) it stated:
“The CCHA was disbanded after the 2012–13 season as the result of a conference realignment stemming from the Big Ten Conference (of which three CCHA schools; Michigan, Michigan State, and Ohio State, were primary members) choosing to sponsor Division I ice hockey beginning in the 2013–14 season. The remaining CCHA members received invitations to other conferences, such as the newly formed National Collegiate Hockey Conference (NCHC), Hockey East, and the Western Collegiate Hockey Association (WCHA), which itself had been depleted by the Big Ten and NCHC. The conference’s last game before its hiatus was the final of the 2013 CCHA Men’s Ice Hockey Tournament at Joe Louis Arena in Detroit, where Notre Dame beat Michigan 3–1 to win the Mason Cup championship.”
With that I combined the seven leagues together because the NAHL and USNTDP are both similar institutions. It will be slightly different than the past two ramblings as I have more leagues to go over that had teams move around within leagues and there were times players did not get drafted from either league.
USHL: https://dobberprospects.com/prospect-rambling-decade-of-drafting-ushl/
BCHL/AJHL: https://dobberprospects.com/prospect-ramblings-decade-of-drafting-bchl-and-ajhl/
But first, here is my #GoodTweet of the week hoping for complete chaos:
Please Toronto https://t.co/Ye7Hed4e0E
— Pat Quinn (not that one) (@FHPQuinn) June 28, 2020
*********************
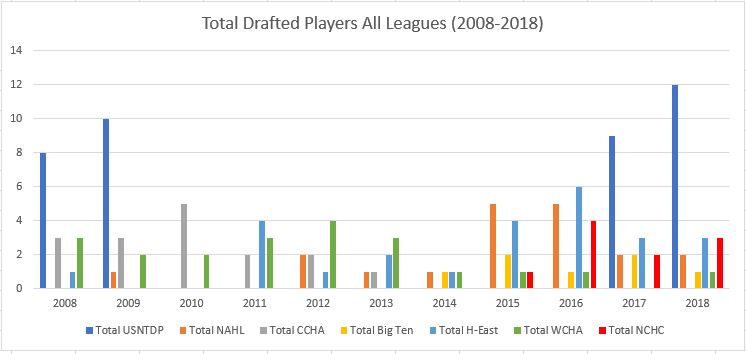
The total amount of players drafted for the USNTDP, NAHL, CCHA, Big Ten, H-East, WCHA, and NCHC leagues from 2008-2018 were 137, with 34.31% becoming either NHL players (rules for this listed in my previous ramblings linked above) or top/legitimate prospects. There were 23 additional players drafted out of those leagues in 2019 with 17 coming from the USNTDP.
Now if you just use the CCHA, Big Ten, H-East, WCHA, and NCHC, as they are the leagues that have most run through each other, there were a total of 79 players drafted and a success rate of 39.24%.
To break everything down by league (2008-2018):
- USHL: 39 total players and a 25.64% success rate, drafted in 2008,2009, 2017 and 2018
- NAHL: 19 total players and a 31.58% success rate
- CCHA: 16 total players and a 25% success rate, league dissolved after 2013
- Big Ten: Seven total players and a 42.86% success rate, only drafted in 2014 and beyond
- H-East: 25 total players and a 56% success rate
- WCHA: 21 total players and a 19.05% success rate
- NCHC: 10 total players and a 60% success rate, drafted between 2015 and 2018 only
Now for a whole bunch of bar charts. First up are all the total drafted players from each league
This is to add in 2019 drafted players

Then if you add in all players drafted from these leagues per year (with 2019) you get this chart
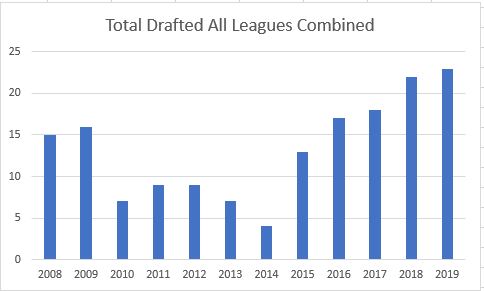
There was strong representation in 2008 and 2009 with 31 players total, an average of 15.5 players. Then from 2010 to 2014 barely anyone was drafted in the seven leagues, 36 total players which is an average of 7.2 players. From 2015 onwards it has become a steady increase going 13, 17, 18, 22 and 23, for an average of 18.6 with 93 players drafted over that time frame.
Here is if the leagues are separated first starting with the USNTDP and NAHL, separate
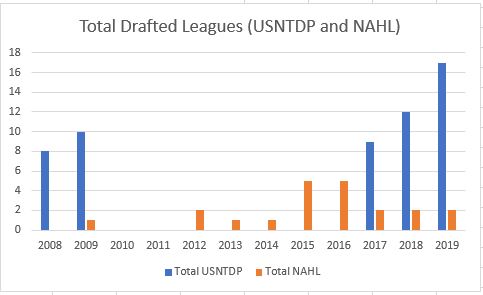
Quite interested how the USNTDP had no one drafted between 2010 and 2016, and I could not find out why
Combined per year

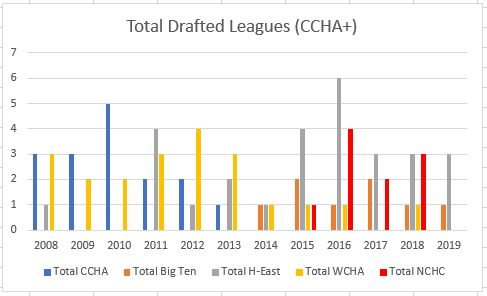
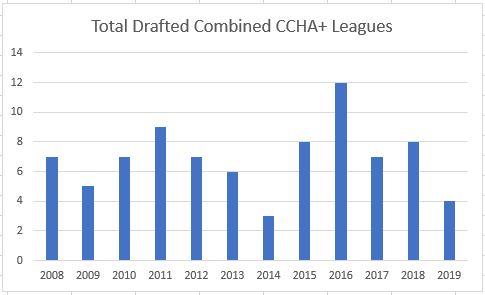
The five other leagues drafted per year give you an example how the leagues swapped teams, or were dissolved, from the CCHA, Big Ten, H-East, WCHA, and NCHC which I referred to as CCHA+
This is what the five leagues look at if you combine them year over year
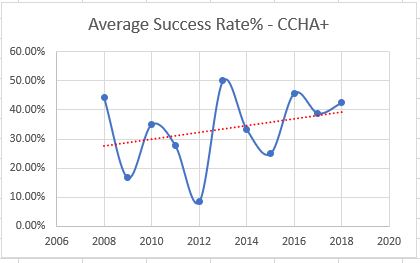
The average success rate of the CCHA+ teams per year are
I cannot make one for the USNDTP and NAHL combined together as there are years where no one is drafted, and the chart really does not show anything.
With that the average success rate of all the leagues together year over year is
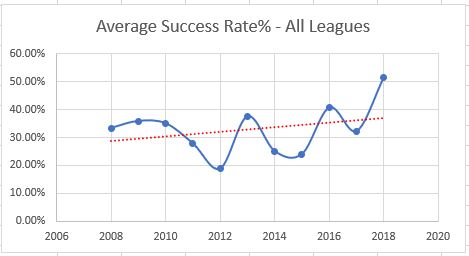
You can see how the leagues trend upward as teams get better at developing prospects. Also, the unknown players of 2016 to 2018 that I still give a chance to being a legitimate prospect skew the results slightly as well, so perhaps the leagues do not trend up as much as it appears. To help the percentage numbers from being too skewed I did divide the last year with an average overall success rate of which round they were drafted (which sounds way more complicated than it was).
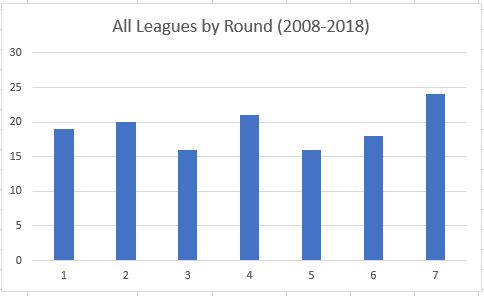
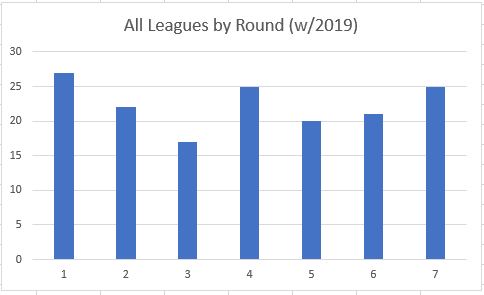
I went over each round from 2008 to 2018 to see where each player from each league was drafted. The results are pretty similar per round always being between 15 and 25 for any round.
If you add in 2019 the added the eight players drafted the USNTDP in the first round really change the results
Now on to the success rate per round (2008-2018)
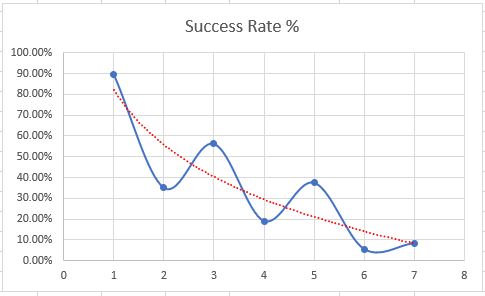
This is my favorite chart as a few things pop out randomly:
- Round one for all the seven leagues had a 89.47% success rate, with only the WCHA and H-East having players that did not make it (one per league)
- All players drafted in round one from the USNTDP, CCHA, Big Ten and NCHC all became NHL players or top prospects
- Odd numbered rounds have a greater success that even number rounds. Even round five has a greater success rate of round two, with 37.50% to 35% respectively
- The trendline of the draft success rate still mirrors the draft pick values, but it does not drop off as drastically thanks to rounds three and five
- The only leagues to have a successful player drafted in round six is the CCHA
- The only leagues to have successful players drafted in round seven is the NAHL, with two
**********************
That concludes this Decade of Drafting series for this week. Next week I will also have a load of teams to look at from some leagues. If you are wondering: Yes, when I do make my pictures I make them look low rent on purpose as I hope readers enjoy and it brings laughter to your day
Follow my twitter: @FHPQuinn
LATEST PROFILE UPDATES
LATEST RADIO & DRAFTCASTS
Dobber’s DraftCast S2E8: Atlantic Division Prospects with a chance to make the roster
On this episode: Pat is joined by Ben to discuss prospects in the Atlantic Division who have a chance to make the roster to start, have cups of coffee, or may be up after the trade deadline. This talk is to help fantasy hockey GMs decide on prospects to add, watch or invest in for […]
Dobber’s DraftCast S2E7: Metro Division Prospects with a chance to make the roster
On this episode: Pat is joined by Ben to discuss prospects in the Metro Division who have a chance to make the roster to start, have cups of coffee, or may be up after the trade deadline. This talk is to help fantasy hockey GMs decide on prospects to add, watch or invest in for […]
Dobber’s DraftCast S2E6: Central Division Prospects with a chance to make the roster
On this episode: Pat is joined by Ben to discuss prospects in the Central Division who have a chance to make the roster to start, have cups of coffee, or may be up after the trade deadline. This talk is to help fantasy hockey GMs decide on prospects to add, watch or invest in for […]