Prospect Ramblings: Decade of Drafting – Finland
Pat Quinn
2020-08-19

Welcome to the Thursday Prospect Ramblings which is the last in my series looking at drafting over the past decade out of certain leagues. I will wrap up looking at Finland, and let me tell you I swear I saw more players drafted out of this league but was wrong so the success rates are obviously somewhat inflated or deflated depending on the number of players drafted per year/round.
Here are all of the Previous works:
BCHL/AJHL: https://dobberprospects.com/prospect-ramblings-decade-of-drafting-bchl-and-ajhl/
USHL: https://dobberprospects.com/prospect-rambling-decade-of-drafting-ushl/
USNDTP, NAHL, CCHA, Big Ten, H-East, WCHA and NCHC: https://dobberprospects.com/prospect-ramblings-decade-of-drafting-part-3/
High-xxxx Leagues: https://dobberprospects.com/prospect-ramblings-decade-of-drafting-part-4/
Russia, Slovakia, Czech Republic, Belarus, Denmark, Norway and Switzerland: https://dobberprospects.com/prospect-ramblings-decade-of-drafting-rusczesvknordenbelsui/
Sweden: https://dobberprospects.com/prospect-ramblings-decade-of-drafting-sweden/
Also here is my #GoodTweet for you all to enjoy (just pretend they were threaded here):
How do you hit far side here?https://t.co/fkHTsucpeq
— Pat Quinn (not that one) (@FHPQuinn) August 17, 2020
Which goal was more impressive?
— Pat Quinn (not that one) (@FHPQuinn) August 17, 2020
************
There was a total of 107 players drafted out of leagues in Finland. Using my metrics, the leagues had a success rate of 50.47% but averaging it out over the decade brought that number to 42.33%, which is likely much closer to the real mark.
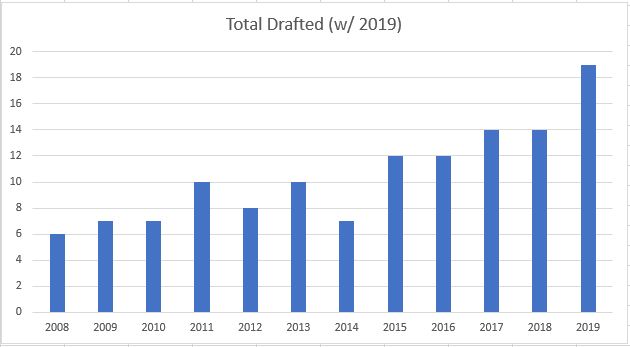
The pattern out of Finland is that the number of players drafted out of the leagues there increased from the lows in 2008-2010, the slight increase from 2011-2014, and then an increase from 2015-2018 with the four largest years.

Then the most players were drafted out of the leagues in Finland in 2019
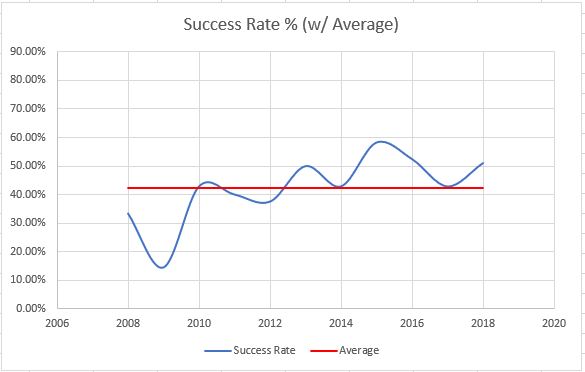
The success rate is an increase but the numbers are tough to trust as there just are not a lot of players drafted per year. However, from 2008-2013 the success rate is lower than the 2013-2018 period. The reason for the second half is two-fold. On one hand Finland has worked on development and there is more scouting in Europe, and on the other hand are my assumptions that players could still become something in the NHL because they are still a good prospect for the team

I decided to put the average per year as a line on the graph to see, and the design is great (I just wish I thought of it sooner)
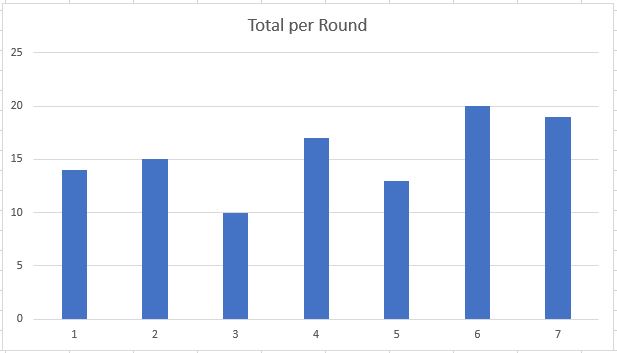
Now for the players drafted per round from 2008 to 2018, which is quite even. Except round three, no one likes round three
Then if you add on the 2019 picks
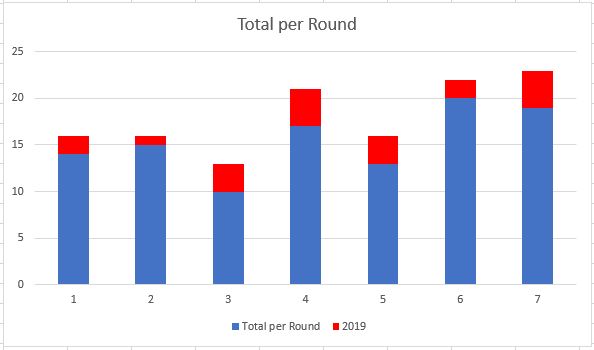
The success rate almost mirrors how the historical round by round picks go, except round three thanks to three of the ten players working out. Round three was inflated due to a low number of picks. I also think that if you were to just shave 20% off of each number (40% for round three) it would be quite similar to the overall pick selection
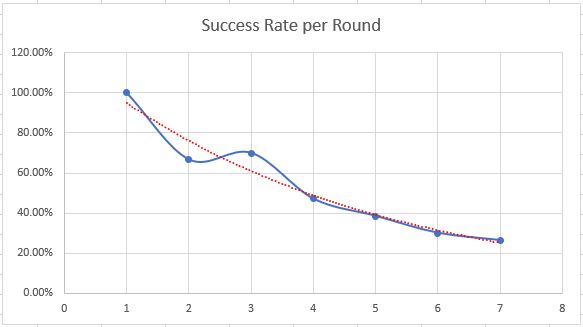
It is neat how all 14 of the players drafted out of the leagues in Finland for round one worked out, a success rate of 100%
**************
That is all for this series, I hope you enjoyed!
Follow my twitter: @FHPQuinn
LATEST PROFILE UPDATES
LATEST RADIO & DRAFTCASTS
Dobber’s DraftCast S2E8: Atlantic Division Prospects with a chance to make the roster
On this episode: Pat is joined by Ben to discuss prospects in the Atlantic Division who have a chance to make the roster to start, have cups of coffee, or may be up after the trade deadline. This talk is to help fantasy hockey GMs decide on prospects to add, watch or invest in for […]
Dobber’s DraftCast S2E7: Metro Division Prospects with a chance to make the roster
On this episode: Pat is joined by Ben to discuss prospects in the Metro Division who have a chance to make the roster to start, have cups of coffee, or may be up after the trade deadline. This talk is to help fantasy hockey GMs decide on prospects to add, watch or invest in for […]
Dobber’s DraftCast S2E6: Central Division Prospects with a chance to make the roster
On this episode: Pat is joined by Ben to discuss prospects in the Central Division who have a chance to make the roster to start, have cups of coffee, or may be up after the trade deadline. This talk is to help fantasy hockey GMs decide on prospects to add, watch or invest in for […]