NHL Draft Pick Probabilities for Fantasy Hockey
Jokke Nevalainen
2020-06-17
This is the fourth article where I analyze the results of NHL Drafts between the years 2000 and 2009. This time, I’m looking at probabilities for fantasy hockey purposes. That means, skaters who can put up points and goalies who play a lot of games with good save percentage.
The first three parts can be found from here:
- NHL Draft Pick Probabilities
- NHL Draft Pick Probabilities By Position
- Best and Worst Teams at Finding NHL Players from the Draft
Quality of players
To quantify the quality of the player for fantasy hockey purposes, I split all drafted players into six categories based on their career stats. In the table below, you’ll find the minimum requirements to reach the player quality category. I have also assigned a value to each category – more on that later.
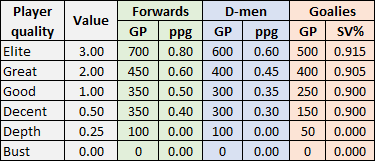
The idea behind the categories is that elite players are rare and difficult to find. They are the best of the best, franchise cornerstones. Great players are also valuable pieces but in shallow leagues, these ones are not that difficult to find. In shallow leagues, you don’t need to look any further than these two categories.
The good players are pretty easily replaceable even in leagues that are a bit deeper. For decent players to be of interest, you’d have to play in a very deep league. And depth players are only for the deepest of the deep leagues.
After setting the player quality standards, I checked to see how many players qualify for each category. I broke down the results based on player’s position.
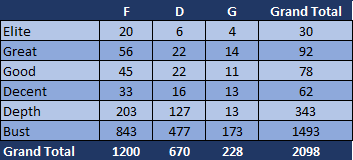
Remember that this is a 10-year sample, so on average, one draft would produce three elite players, nine great players, eight good players, and six decent players. That means a total of 12 players per year for shallow leagues, a total of 20 players for deep leagues, and a total of 26 players for super-deep leagues. I’m pretty happy with those numbers, so I think the player quality categories were set pretty accurately.
Realized value
Next, let’s break down the results by draft round. For this, I’ll use the “Value” mentioned in the first table. The value of busts is zero, so they will be ignored here.
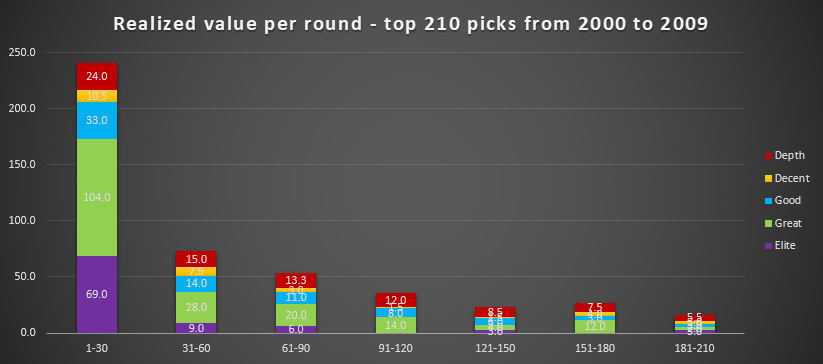
As we clearly see from here, most of the value is in the first round. Out of the 30 elite players drafted in this span of 10 years, 23 (76.7%) were drafted in the first round. Out of the 92 great players, 52 (56.5%) were drafted in the first round. And out of the 78 good players, 33 (42.3%) were drafted in the first round. So the high-end talent is definitely mostly there in the first round.
But as we all know, there’s a big difference between drafting first overall and drafting 30th overall, so let’s break down the first round into each individual selection.
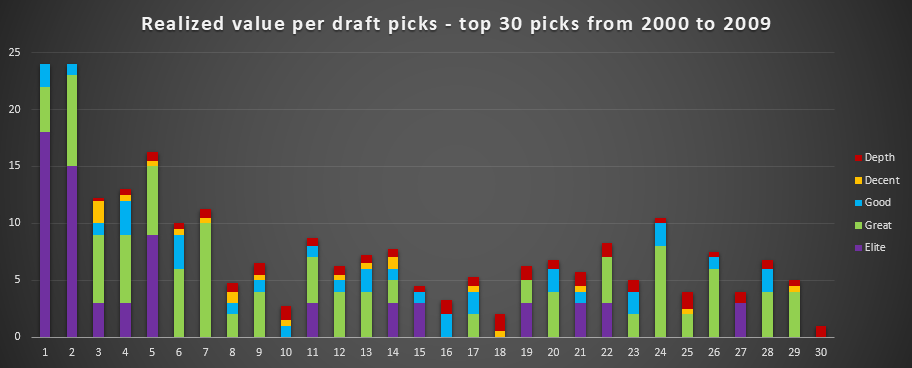
Not surprisingly, 11 of the 23 elite players drafted in the first round were drafted either first or second overall. The interesting thing here is that the first and second overall selections are identical in value. Obviously it’s always better when you get to choose the one you like between the top two choices but as far as value goes over a long period of time, they’re pretty even.
The second surprise here comes at picks three and four. They’ve produced less value than the fifth overall selection. The fifth overall selection has produced three elite players whereas the third and fourth selections have produced just two combined.
Even though the sixth and seventh selections haven’t produced any elite players, they’ve produced a very good amount of great talent which pushes their value almost to the level of the three picks ahead of them.
The value drops off the cliff after the top seven, though. There’s virtually no difference between the eighth overall and 29th overall selections. In fact, the 29th overall selection has produced more value than the eighth overall selection. There are some ups and downs between them but all in all, things are pretty steady in that range.
What on earth has happened to picks 10 and 18? Those are some awful results they’ve produced. The 27th pick would be equally bad but luckily, it has produced one elite player which pushes the value way up.
There is another big drop-off at pick 30, and things are not a whole lot better after that. The chart below shows the rest of the draft grouped by 10.
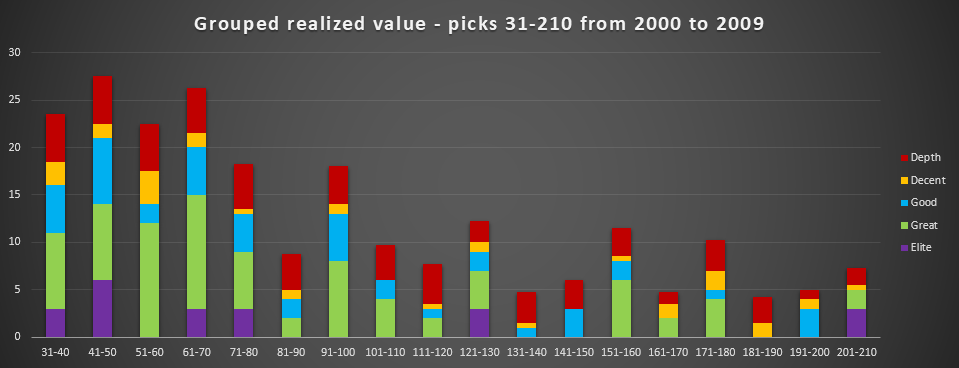
Please remember that the value is aggregated here, so divide it by 10 to get the value of an individual draft selection e.g. selections between 31 and 40 would be around 2.4 in value when comparing to the first round chart.
Picks from 31 to 70 still provide some sort of value but after that, it comes down to finding the right individual among hundreds of selections – not an easy task by any means.
Quality of players per draft range
Using the results so far, I split all draft selections into eight groups based on the similarity of results. The first round is split into four groups, and then the rest of the draft is split into four more.
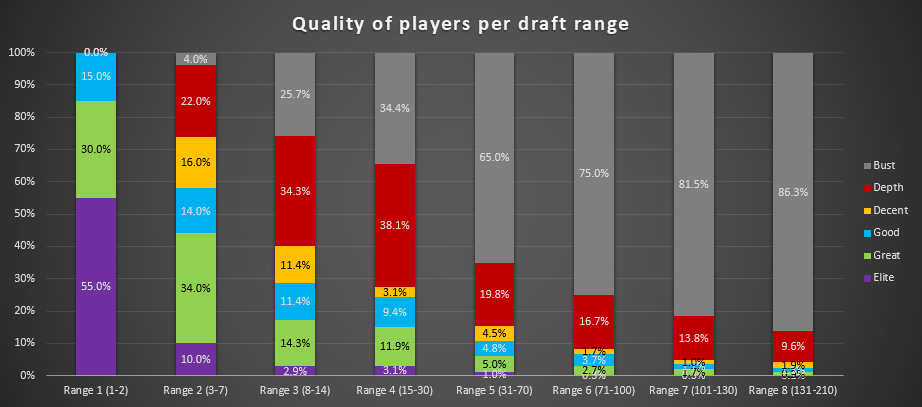
From here, we can see the actual probabilities. For example, you have a 55% chance of finding an elite player with a top two pick, and an 85% chance of finding at least a great player there.
In shallow leagues, you should do your best and try to move up to the top seven because after that, the odds of finding a fantasy worthy player drop down to 17.2% which is just not good enough. The picks from eight to 30 provide a lot of depth players but not a whole lot else.
Using the realized values in each of these draft ranges, I was then able to calculate the expected value return for selection in these ranges.
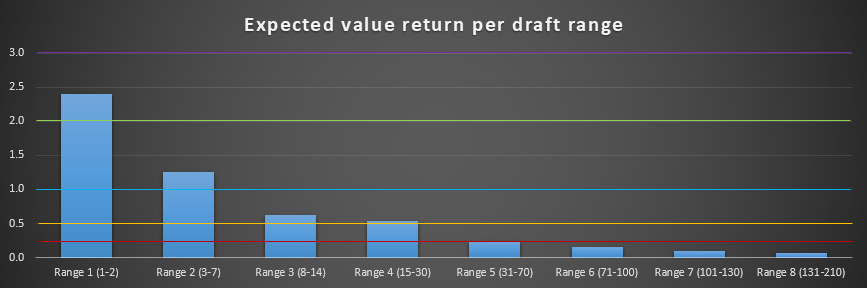
I added colored lines to highlight the value of each player quality category as defined in the first table. You can read this chart as such:
- With a top two pick, you’re expected to find at least a great player with a good chance of finding an elite player.
- With a pick in the 3-7 range, you’re expected to find at least a good player with a good chance of finding a great player.
- And so on.
NHL teams
Using all the information mentioned above, I was then also able to calculate how good and bad each NHL team has been at finding offensive talent with the draft picks that they’ve had. Please notice that this is mostly just for fun because it doesn’t take defensive capabilities into consideration at all, so this is far from a perfect way to evaluate the results of the NHL teams but I figured it would be an interesting thing to see nonetheless.
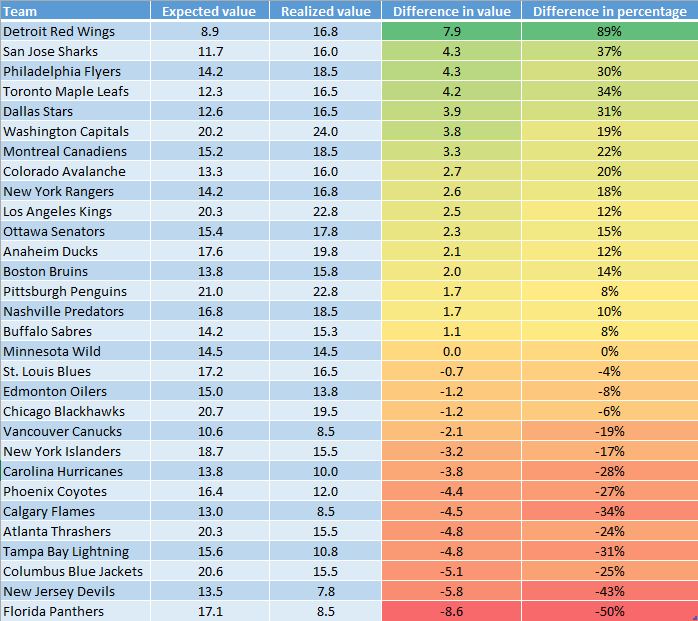
Detroit with a massive lead over all the other teams in the league, whereas the Panthers are by far the worst. These results are somewhat similar as to when I looked at best and worst teams at finding NHL players (without taking the quality of those players into consideration), so these two teams being at the opposite ends is not surprising but the difference between them and the next team is surprisingly big.
*
And that’s all for now, thanks for reading. Remember to follow me on Twitter @JokkeNevalainen.
Main picture courtesy of NHL.com
LATEST PROFILE UPDATES
LATEST RADIO & DRAFTCASTS
Dobber’s DraftCast S2E8: Atlantic Division Prospects with a chance to make the roster
On this episode: Pat is joined by Ben to discuss prospects in the Atlantic Division who have a chance to make the roster to start, have cups of coffee, or may be up after the trade deadline. This talk is to help fantasy hockey GMs decide on prospects to add, watch or invest in for […]
Dobber’s DraftCast S2E7: Metro Division Prospects with a chance to make the roster
On this episode: Pat is joined by Ben to discuss prospects in the Metro Division who have a chance to make the roster to start, have cups of coffee, or may be up after the trade deadline. This talk is to help fantasy hockey GMs decide on prospects to add, watch or invest in for […]
Dobber’s DraftCast S2E6: Central Division Prospects with a chance to make the roster
On this episode: Pat is joined by Ben to discuss prospects in the Central Division who have a chance to make the roster to start, have cups of coffee, or may be up after the trade deadline. This talk is to help fantasy hockey GMs decide on prospects to add, watch or invest in for […]

