Prospect Ramblings: Decade of Drafting (Part 4)
Pat Quinn
2020-07-08

Welcome to the Thursday prospect ramblings where I still continue my Decade of Drafting series. This week I will look at the High-MN, High-MA, High-CT, High-NH, High-NJ, High-WI, High-QC, High-MI, High-ON, High-NY, and High-IN. I may add in the other leagues to see the success they have as there likely will not be much prospect hockey, at least in North America as Europe and Russia are likely going ahead in September. Here are the past series parts:
Part 1: https://dobberprospects.com/prospect-ramblings-decade-of-drafting-bchl-and-ajhl/
Part 2: https://dobberprospects.com/prospect-rambling-decade-of-drafting-ushl/
Part 3: https://dobberprospects.com/prospect-ramblings-decade-of-drafting-part-3/
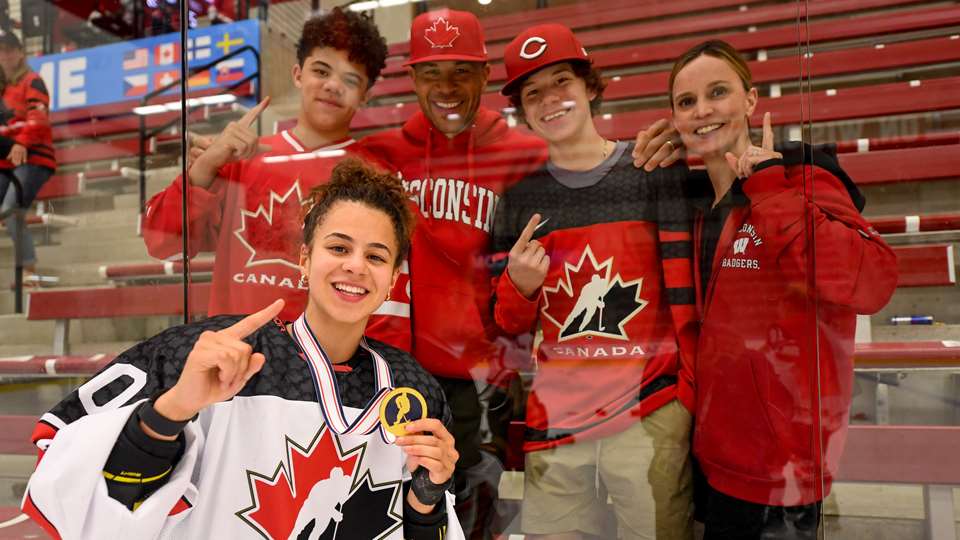
Here is my #GoodTweet of the week:
Line 5 did not play together, and Guentzel looked wicked with Geno and Rust… What is this haha https://t.co/pLv7RCWB7j
— Pat Quinn (not that one) (@FHPQuinn) July 2, 2020
*******************************
There was a total of 163 players being drafted out of the High-MN, High-MA, High-CT, High-NH, High-NJ, High-WI, High-QC, High-MI, High-ON, High-NY, and High-IN leagues. Out of those leagues:
- 83 drafted from High-MN; 50.92% total
- 31 drafted from High-MA; 19.02% total
- 18 drafted from High-CT; 11.04% total
- 14 drafted from High-NH; 8.59% total
- 17 drafted from the other seven leagues (High-NJ, High-WI, High-QC, High-MI, High-ON, High-NY, and High-IN); 10.43% total
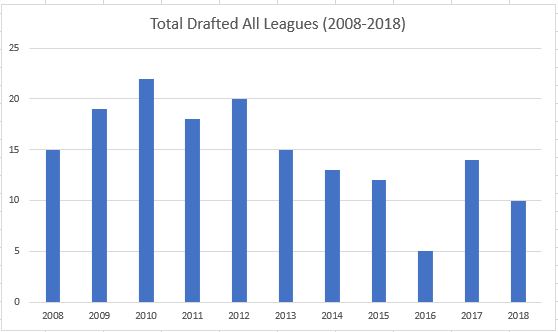
The overall success rate of the 11 leagues was only 17.18%, meaning 82.82% of players do not work out, later in these ramblings you will see that most players get drafted in the fifth round or later. The players drafted out of these leagues has also dropped since 2013, and the totals from 2008 to 2018 are
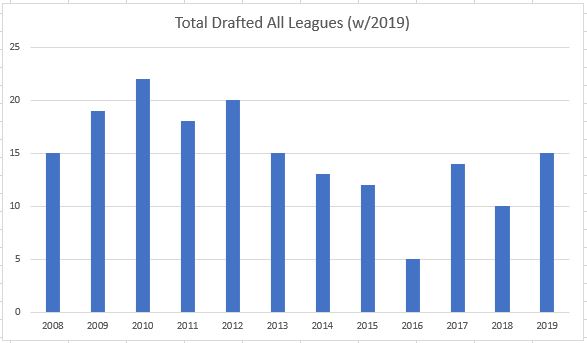
2019 saw a rebound of sorts (to 2013 levels) as there were 15 players drafted out of those leagues
I also decided with so many leagues to make this hand chart to see where all players were drafted out of by year (plus colours)

A few notes:
- There were never more than three players drafted from the other seven leagues
- High-MN always has at least three players drafted out of that league
- High-MA (the second highest drafted league) never had a player drafted in 2008 and 2016, 2016 of course only have five players drafted out of it
- There was always at least one player drafted out of High-CT and High-NH combined, but each had three years where they did not have a player drafted
The total success rate is fun to look at
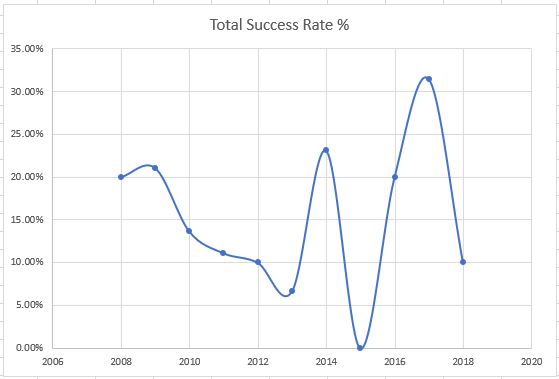
A couple notes:
- No player drafted in 2015 turned out, out of 12 players, but one of the five players drafted in 2016 looks like he could become a success. That player is Patrick Harper drafted by Nashville in round five as they remain high on him, though size may hold him back
- 2017 is quite high as eight of the players at least looking like they could become successes, and I had to reduce that number by a percentage as 57.14% success is much to high based on the leagues’ history and rounds in which they were drafted
Here is what the success rate looks like when not as zoomed in (something I feel like I should have done in the past couple of ramblings)

Notes:
- High-WI with five players, and High-NJ, High-MI, High-IN, all with two players, had a zero-success rate
- High-QC had one player drafted overall who is a success, Mark Jankowski in 2012 (NHL player = success)
- High-MA has the highest success rate at 19.35%, 2% above the average, but only has six players turn out opposed to the 14 that are successes from High-MN. High-MN’s success rate being 16.87%
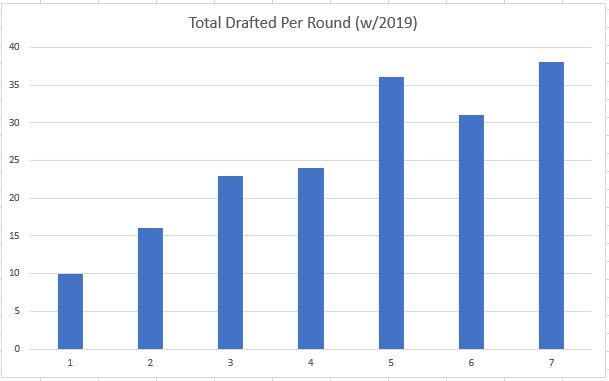
Here is where the players get drafted in each round from 2008 to 2018
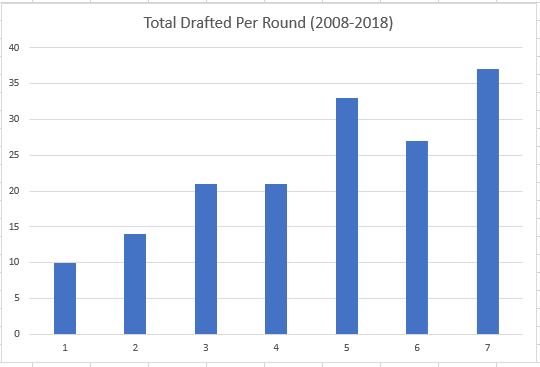
A few notes:
- 66 of the 163 players were drafted in rounds one to four, with only 10 players in that time frame being drafted in round one
- The remaining 97 players were drafted in rounds five to seven
The success rate per round mimics closely (with the trendline) how NHL draft picks turn out from rounds one to seven
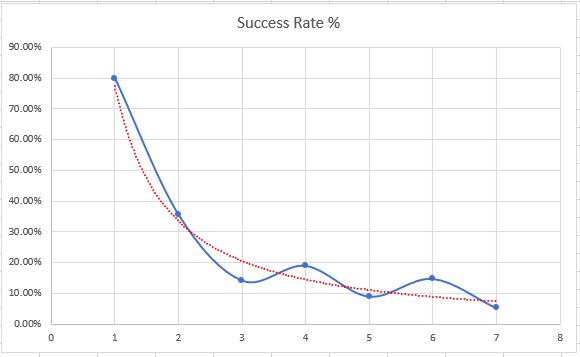
Interesting tidbits:
- Rounds two, four, and six have a higher success rate than rounds three, five and seven. Which is completely opposite to the leagues in my article last week as rounds three, five and seven had a higher rate for the USNTDP, NAHL, CCHA, Big Ten, H-East, WCHA, and the NCHC leagues:

- The successful picks per round (in order from rounds one to seven) went: 8, 5, 3, 4, 3, 4, and 2 in the final round
- 80% of players drafted in round one from these leagues turn in to NHL players, but if you take out the Jankowski pick, players drafted out of round one has only come out of the High-MN and High-MA leagues (six and three respectively)
- 10 of the 14 players drafted in round two came from High-MN, with the additional four coming from High-MN (two), High-CT and High-NH. Neither player from High-CT or High-NH turned out
- All players drafted from High-MA after round two do not turn out, unless they are in round four where three of the seven drafted in that round were successes. 19 players drafted in rounds three, five, six and seven did not turn out
- From High-MN, 12 players exactly were drafted in each of the rounds three, four and five. None of the 12 drafted in round three turned out, but one turned out in round four and five
- High-NH only has success in rounds three, with both players drafted developing in to players, but the 12 total players drafted in rounds two, five, six and seven did not become successes
There were 15 additional players drafted in 2019, and of those 15 none were drafted in round one, so the chart just looks a little larger after round one
******************
Thanks for reading, next week will see the wrapping up for North America with a whole bunch of smaller leagues.
Follow my twitter: @FHPQuinn
LATEST PROFILE UPDATES
LATEST RADIO & DRAFTCASTS
Dobber’s DraftCast S2E8: Atlantic Division Prospects with a chance to make the roster
On this episode: Pat is joined by Ben to discuss prospects in the Atlantic Division who have a chance to make the roster to start, have cups of coffee, or may be up after the trade deadline. This talk is to help fantasy hockey GMs decide on prospects to add, watch or invest in for […]
Dobber’s DraftCast S2E7: Metro Division Prospects with a chance to make the roster
On this episode: Pat is joined by Ben to discuss prospects in the Metro Division who have a chance to make the roster to start, have cups of coffee, or may be up after the trade deadline. This talk is to help fantasy hockey GMs decide on prospects to add, watch or invest in for […]
Dobber’s DraftCast S2E6: Central Division Prospects with a chance to make the roster
On this episode: Pat is joined by Ben to discuss prospects in the Central Division who have a chance to make the roster to start, have cups of coffee, or may be up after the trade deadline. This talk is to help fantasy hockey GMs decide on prospects to add, watch or invest in for […]