Prospect Ramblings: Stats vs Eye Test
Jokke Nevalainen
2018-11-05
For a long time, the scouting world was split between those who rely on stats and those who rely on the eye test. There were a lot of battles between these groups. But more recently, a lot of people have started to realize both sides have good points. The best modern scouts seem to be the ones who utilize stats and analytics but also spend a lot of time watching the kids.
The way I see it, stats are a good starting point. There are hundreds of interesting prospects playing around the world in 20-30 different leagues. You can’t watch all of them regularly. And that’s why I use stats to identify the players I want to watch.
If my eyes are telling me the same thing stats are showing, then life’s easy. When it becomes more difficult is when stats are telling me one thing but my eyes are telling me something else. Which one do I trust? That’s when mistakes are made, and I still haven’t found a perfect balance for it.
When using stats, it’s also very important to know how to properly interpret them. NHL equivalency (NHLe) has been around for some time now, and it’s a great starting point. The idea is to calculate how many points said prospect would have scored if he had played in the NHL.
The problem with NHLe is that it’s only designed to calculate the immediate impact a prospect makes when making the jump to the NHL from some other league. By itself, it doesn’t say anything else about the prospect.
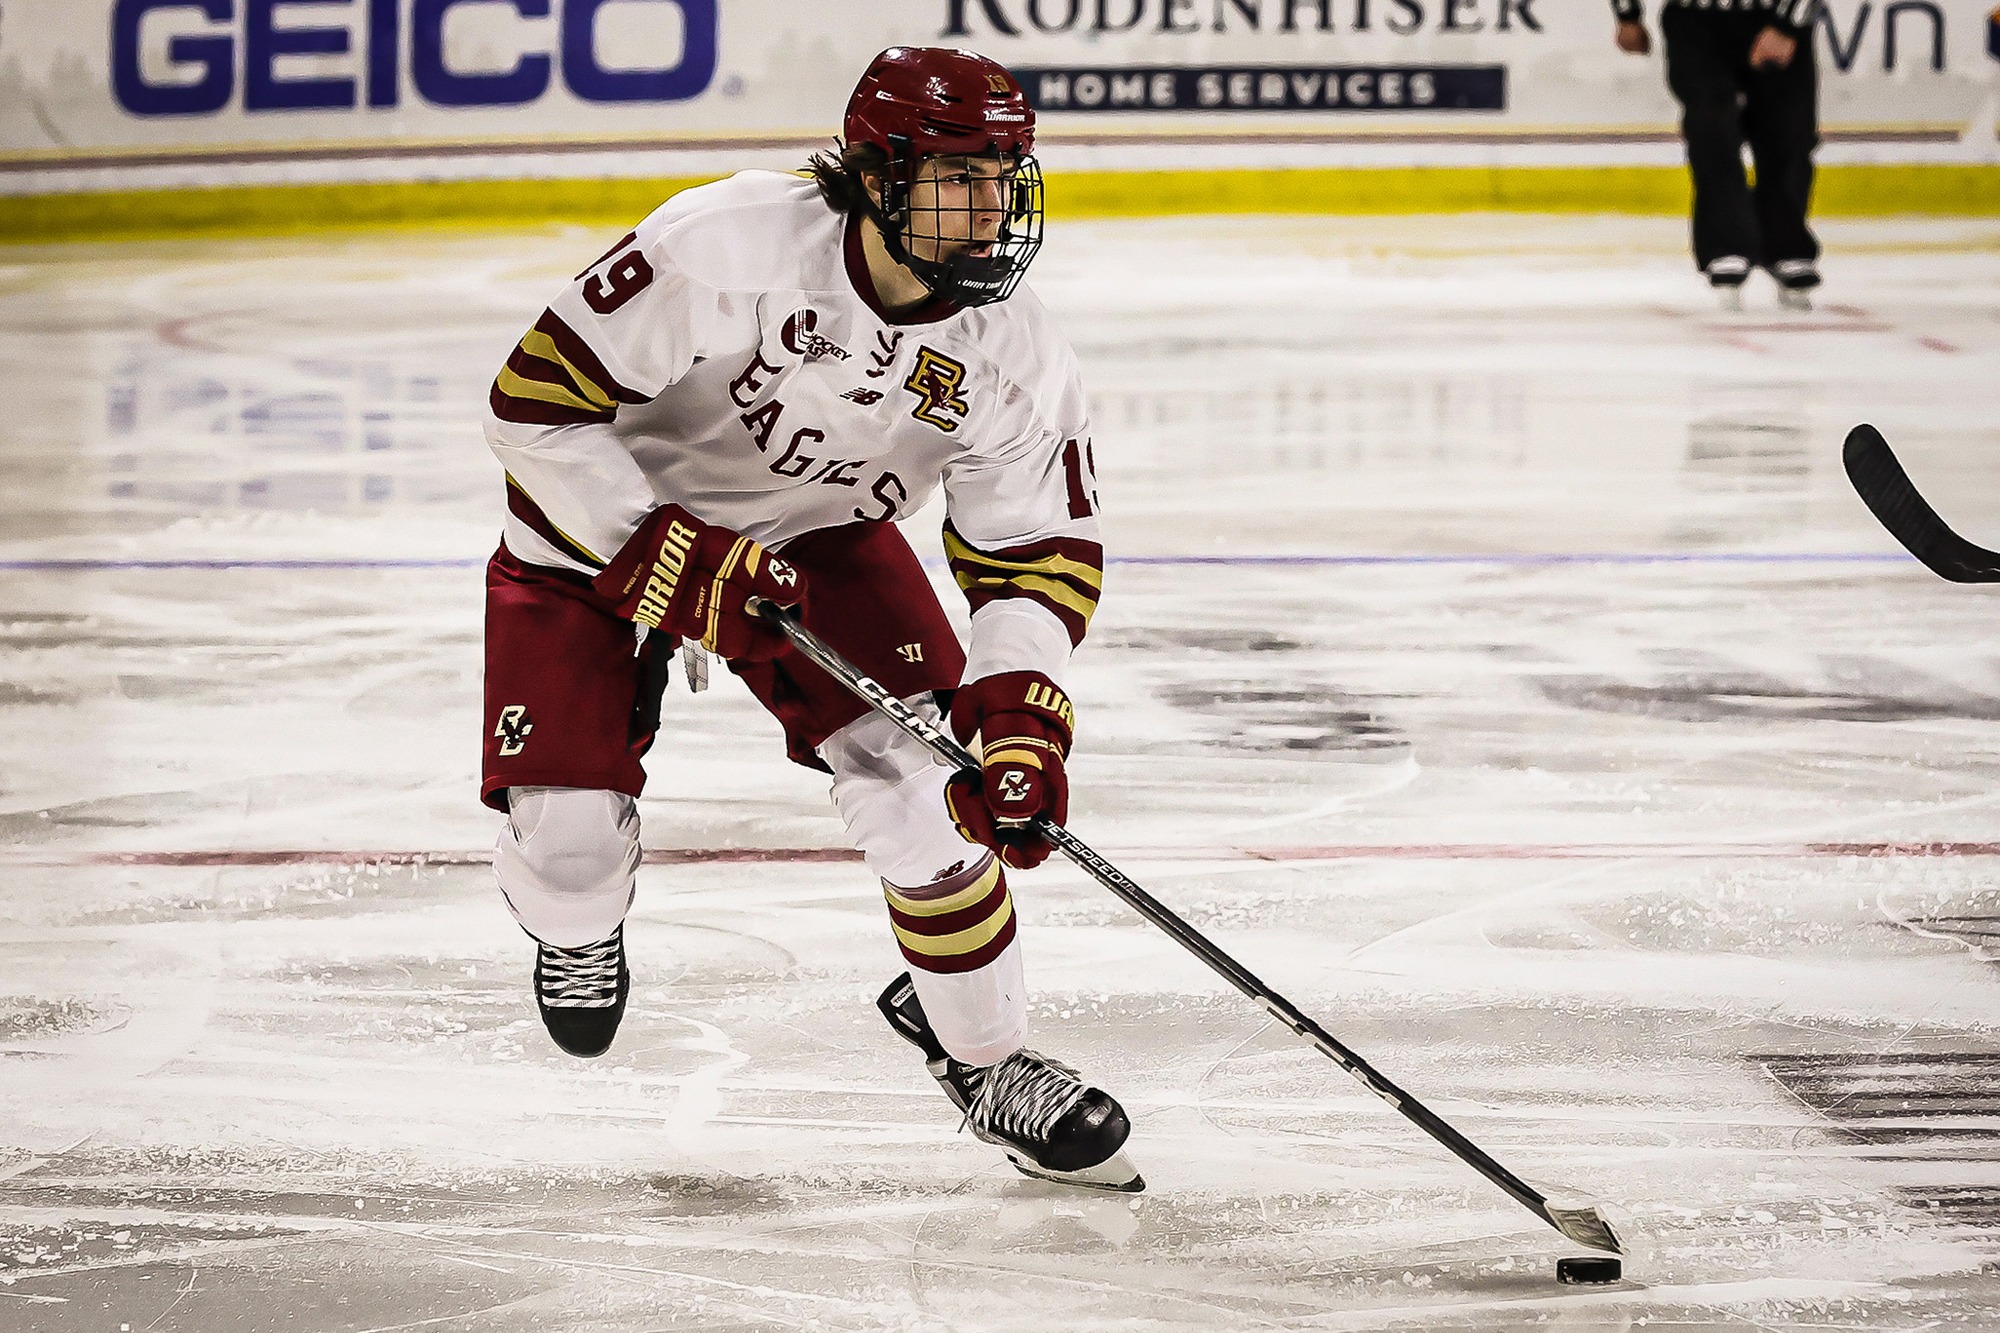
Mason Black has created a stat called PNHLe which also takes age into consideration and projects how many points the prospect may score at the NHL level in his prime. As an example, here’s a graph showing Connor McDavid’s PNHLe values throughout his career so far. It goes all the way back to his rookie season in the OHL when he was just 15 years old.
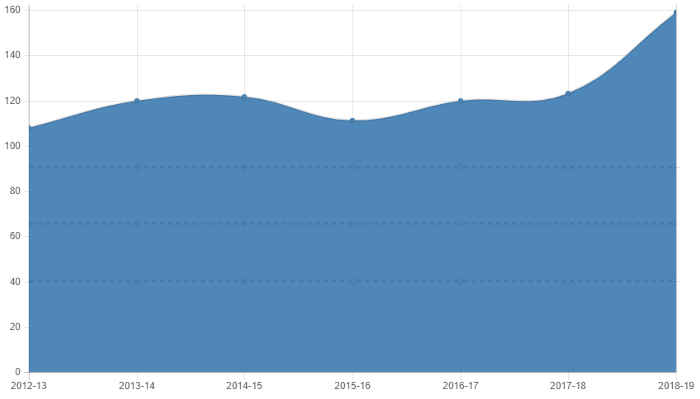
As you can see, McDavid’s PNHLe value was always off the charts good. Throughout his junior career, he was projected to get between 110 and 120 points in his prime at the NHL level. And so far, that’s looking pretty accurate. In McDavid’s case, numbers work perfectly. He was consistently great year after year, and his game developed perfectly each and every season.
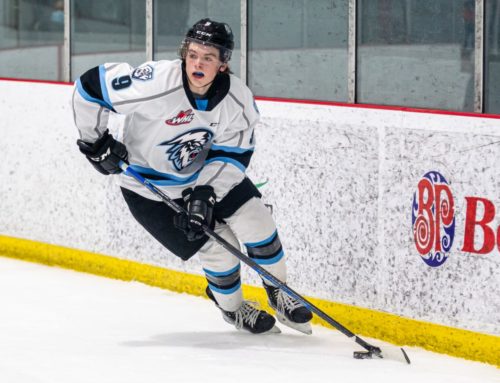
But not everyone develops perfectly. Development is not always linear, and some prospects don’t start showing their true potential until at a later age. As an example, here’s Elias Pettersson’s PNHLe graph.
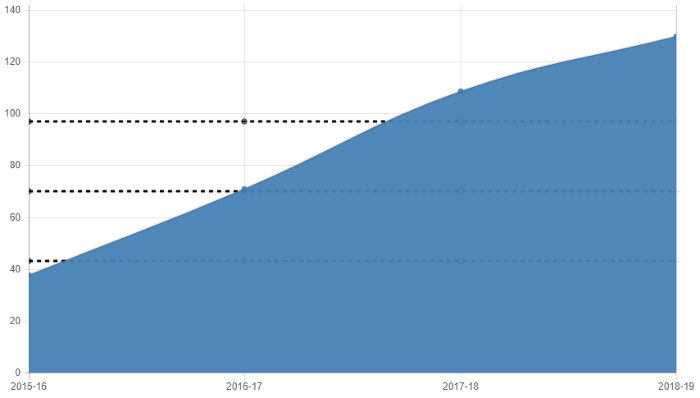
During the 2015-2016 season, Pettersson’s production was nothing special. But he took a big step during his draft year, then he took another big step last year, and now seems to be taking yet another step this year in the NHL. And this is why projecting prospects is so difficult. Life would be so easy if they would all develop similarly.
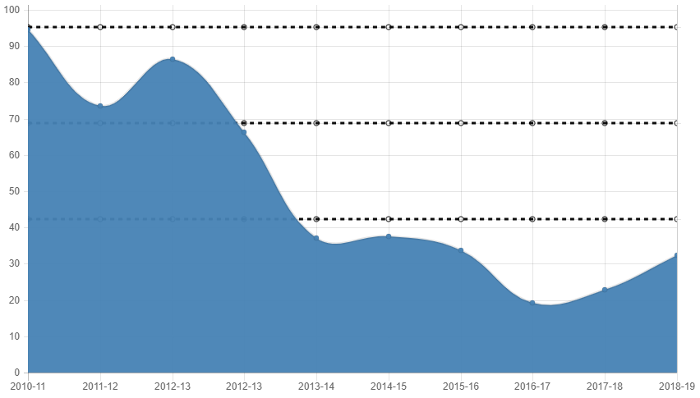
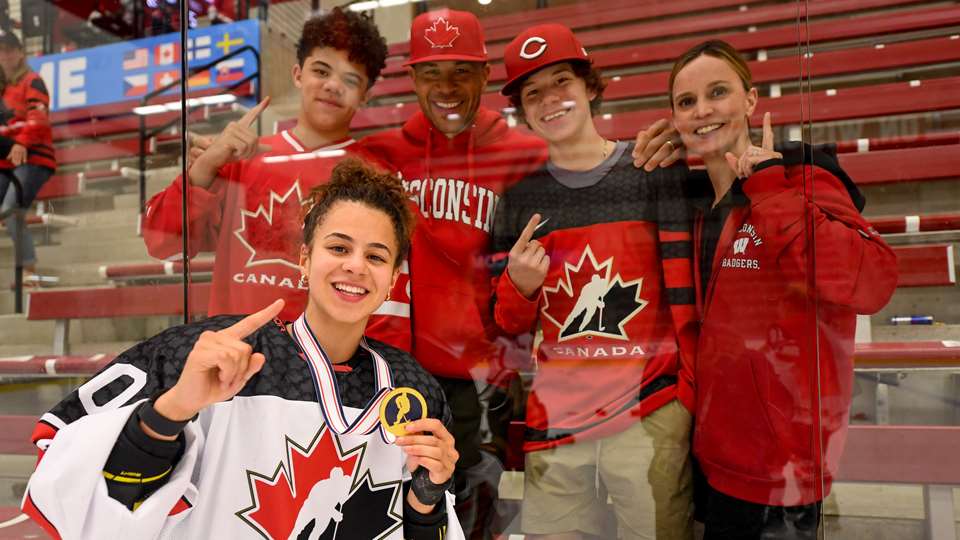
Then there are also cases where the hype around the player far exceeds his numbers. As an example, here’s Casey Mittelstadt’s PNHLe graph.
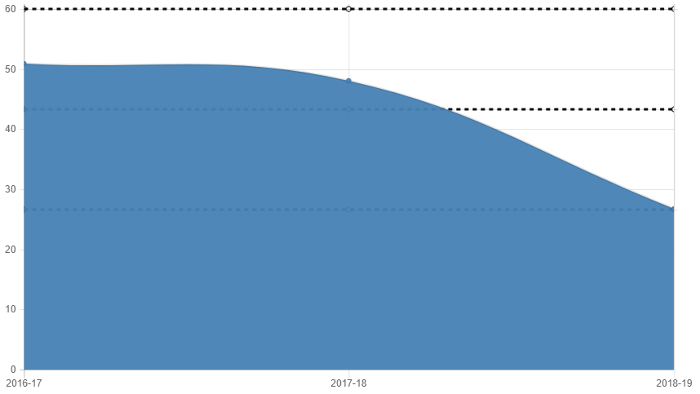
In Mittelstadt’s case, his numbers were never impressive. He’s been consistently average. I do think he will end up being a better player than what the stats are saying but I do admit being swept away with the hype at some point. But last season, when Pettersson’s PNHLe value was about 110, Mittelstadt’s number was about 50. That’s a huge difference.
We here at DobberProspects are very fortunate to have Mason writing monthly articles for us. In case you’ve missed the first ones, I suggest checking them out to learn more:
- Introduction to PNHLe as a Fantasy Tool
- Projecting Prospect Point Potential Using PNHLe – October 2018
Now that we know how to interpret stats properly and we have such a great tool like PNHLe at our disposal, what’s the point of watching those prospects? Well, production doesn’t always match with talents. Sometimes a prospect is posting great numbers but it may be because he’s playing huge minutes, it may be because he’s allowed to cheat for offense, and it may be because he’s benefitting from a superstar carrying their line.
And at the other end of it, a supremely talented player may not be producing much because he’s not getting any support from his teammates or he’s not getting proper usage on the team. If a prospect is making plays left and right but no one is finishing them, they don’t show up on the score sheet.
Without watching prospects, you also don’t know anything about their play without the puck. Offensive production may be the best single indicator of future success but NHL players also need to be defensively responsible. NHL coaches don’t allow their players to cheat for offense.
If you only follow one league and/or a handful of prospects and get to watch them every week, you may not need stats. But if you try to follow a large amount of prospects, it’s impossible to watch them all the time. And that’s when stats become very useful.
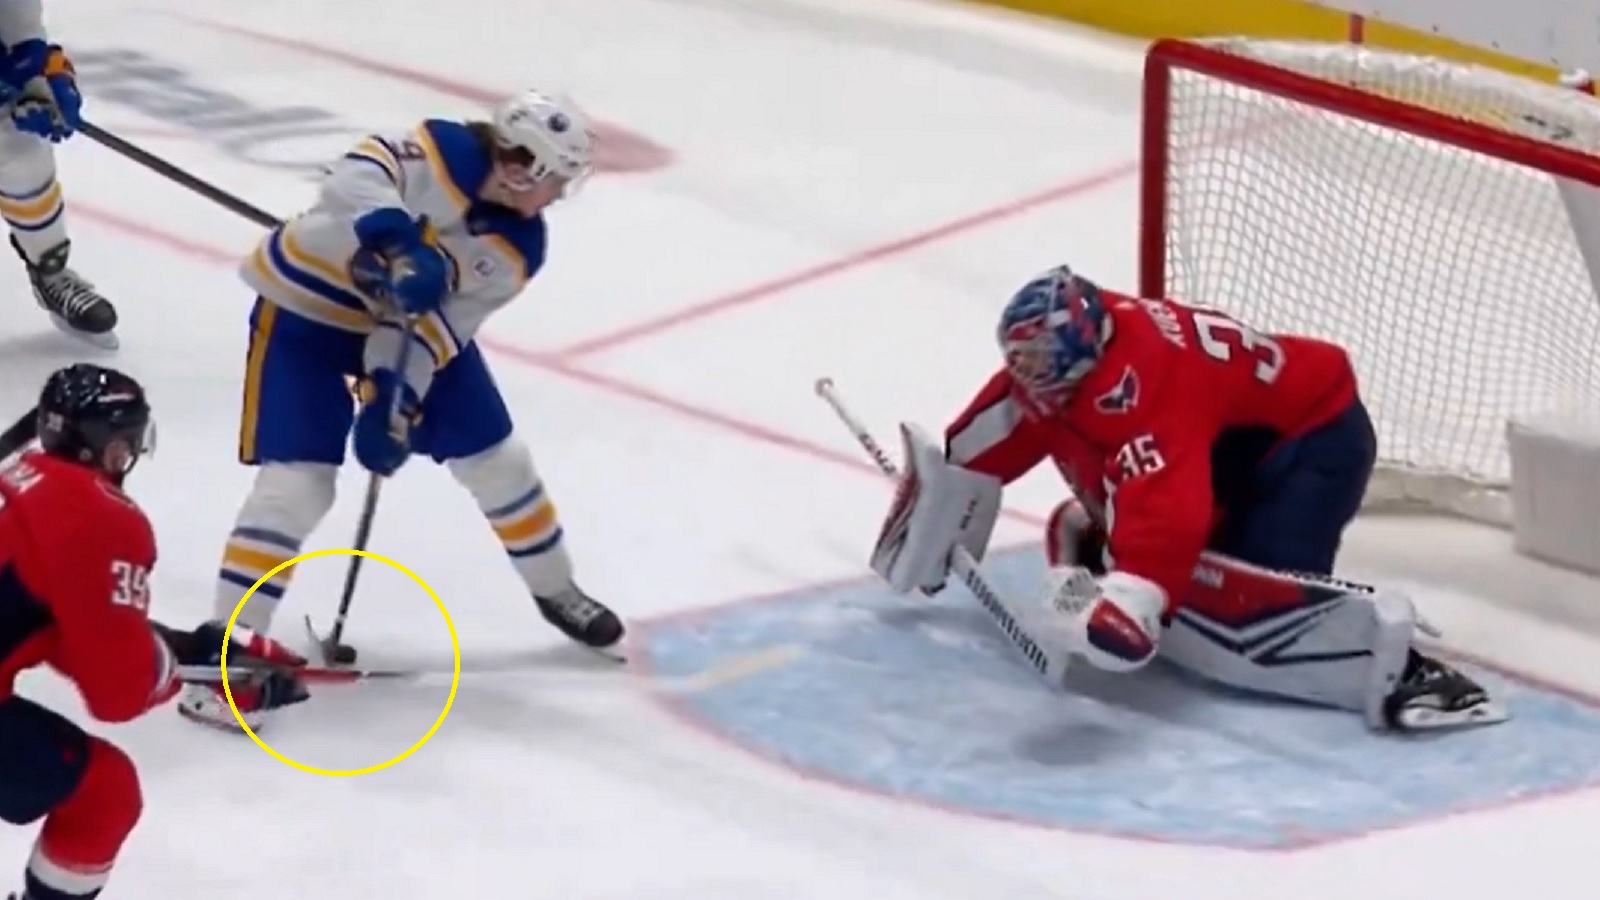
Stats are a great tool to have in your scouting toolbox but they’re not perfect and may never be. As an example, here’s Nail Yakupov’s PNHLe chart. He posted great numbers during his junior career, and he continued posting great numbers during his rookie season in the NHL. But it all went downhill from there.
*
And that’s all for now, thanks for reading. Feel free to add comments below. Remember to follow me on Twitter @JokkeNevalainen.
Images used on the main picture courtesy of CBSSports.com, Vancourier.com and USATodayHSS.com
LATEST PROFILE UPDATES
LATEST RADIO & DRAFTCASTS
Dobber’s DraftCast S2E8: Atlantic Division Prospects with a chance to make the roster
On this episode: Pat is joined by Ben to discuss prospects in the Atlantic Division who have a chance to make the roster to start, have cups of coffee, or may be up after the trade deadline. This talk is to help fantasy hockey GMs decide on prospects to add, watch or invest in for […]
Dobber’s DraftCast S2E7: Metro Division Prospects with a chance to make the roster
On this episode: Pat is joined by Ben to discuss prospects in the Metro Division who have a chance to make the roster to start, have cups of coffee, or may be up after the trade deadline. This talk is to help fantasy hockey GMs decide on prospects to add, watch or invest in for […]
Dobber’s DraftCast S2E6: Central Division Prospects with a chance to make the roster
On this episode: Pat is joined by Ben to discuss prospects in the Central Division who have a chance to make the roster to start, have cups of coffee, or may be up after the trade deadline. This talk is to help fantasy hockey GMs decide on prospects to add, watch or invest in for […]