***
Welcome to Part 2 of my curiosity binge into draft statistics. Last week, I took a look at the leagues and countries that selections in the 2019 Entry draft came from.
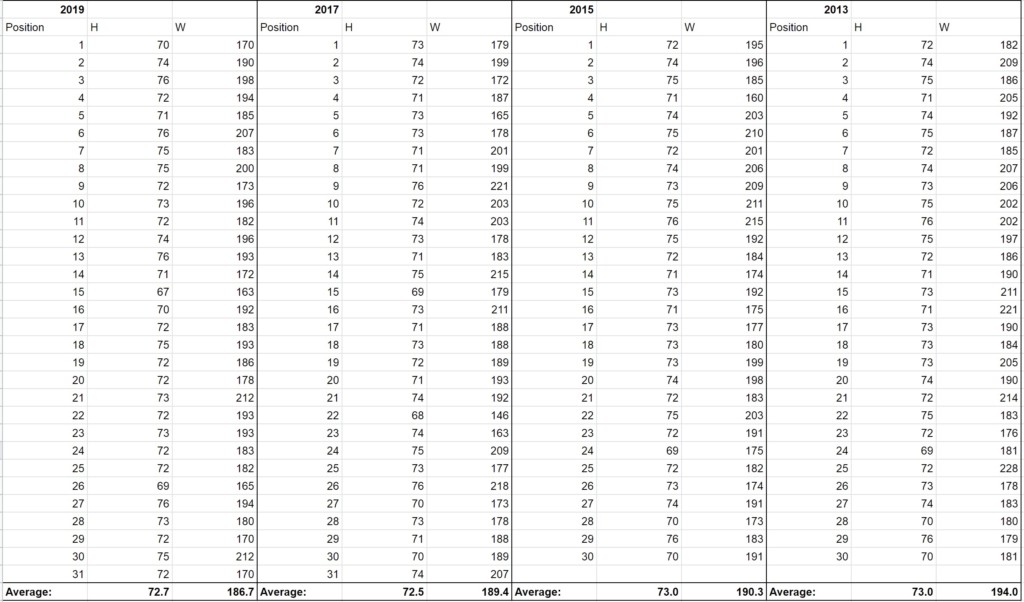
This week, I’m taking a more historical look at the draft. I’ve listed the heights and weights of first-round picks from 2019, 2017, 2015, and 2013, to see if there is a upward or downward trend over these 6 years. The NHL has drastically shifted into a speedier league over this time, but GMs never stop respecting size and grit, so I’m curious about how 1st-round selections have been used differently (or maybe the same as always).
Let’s dig in. Here are some plots of the trends in the first rounds, as well as isolating the top-tens. Full data table below for anyone curious. All data courtesy of NHL.com databases.
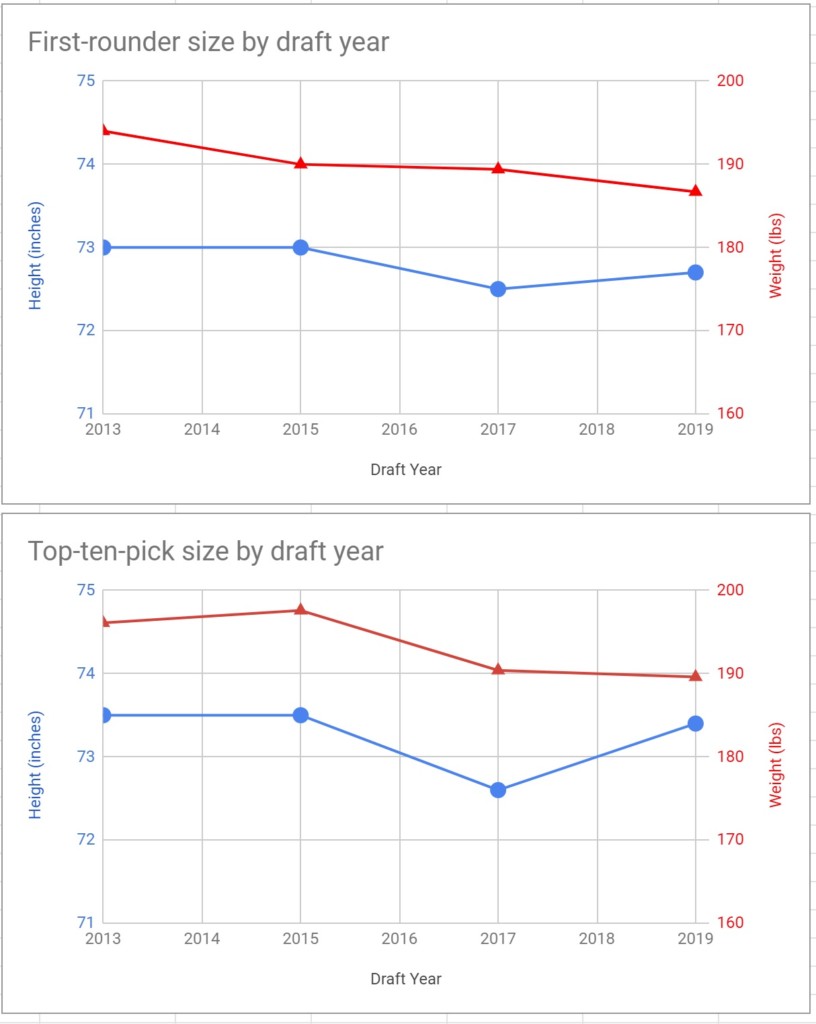
So what do we see?
- First round picks are certainly getting lighter from year to year over the period of 6 drafts at a steady rate. It’s hard to image this trend continuing though, hockey players can only be so light…right?
- The height trend over 8 years is less obvious. There was a dip after 2015, but even within that drop the average height only changed by half an inch. Over 30 (or 31) players, that isn’t a significant difference.
- I know the nerds will ask me – Google Sheets was not behaving when adding on the values but the standard deviations did not differ significantly between years. The only significant point over the years was that 2019 had a slightly higher deviation in heights that usual (meaning that a greater range of heights were selected than usual).
- When we look at only the top-ten picks of each year, the trends are less clear but are similar to the profile of the entire first round. The average height shift up by full inch (so teams certainly don’t like letting taller players slide down the draft), but this value hasn’t seen a significant decline (other than a dip in 2017).
- Like in height, the average weight of a top-ten pick is a few pounds heavier than the average of the entire round. Like seen in the full-round average, this number seems to be on the decline even among top-ten picks.
- So, it does appear that top-ten picks are reasonably representative of the entire first round. They are slightly taller and heavier, but the size trends trickle down throughout the remaining 20 picks.
As promised, here are all the values used for the above plots.
***
Thanks for reading! Now get outside and enjoy the summer. Twitter will be here when you get back.
Hayden Soboleski